What are Key Performance Indicators (KPIs)?
KPIs are simply metrics that help you identify whether your strategies are working or not.
It can sound intimidating. However, there are some basic terms you need to understand before we jump into the KPIs from social media and from your website.
Metrics vs. Dimensions
Putting in the effort to build the foundation for becoming data-driven is more important than any other step. First, we look at metrics & dimensions.
A metric is always a number. It can be, for example, a regular number or a percentage.
Example of a metric: The cost per candidate.
A dimension is always something that you split the metric by. This can be:
- Area of work
- Date
- Source (LinkedIn, Facebook, Instagram, etc)
- Campaign
Example of a metric split by a dimension: The cost per candidate per area of work.
The Recruitment Marketing Funnel
The recruitment marketing funnel is the journey that users take to become candidates. Ask the following questions:
- How many users are seeing my ads from each platform?
- Metric: Ad views (Impressions)
- Dimension: Platform
- How many users are clicking on the ads from each platform?
- Metric: Link clicks
- Dimension: Platform
- How many users who clicked on my ads are landing on my careers website and from which platforms?
- Metric: Website sessions
- Dimension: Platform
- How many users that land on my career site are clicking apply on a job and where did they come from?
- Metric: Clicks on “Apply”
- Dimension: Platform
- How many users that open the application actually end up submitting it – and where are they coming from?
- Metric: Form submissions
- Dimension: Platform
Because of variables such as media spending, comparing numbers such as Conversions, Impressions and Link Clicks, between platforms will not give you any insight.
Instead, compare rates.
For comparisons between platforms, always use percentages. In the funnel above, you would calculate the percentage of users moving from one step to another:
- Ad views to Link Click – Percentage of ad views that turned into link clicks = Link Clicks / Ad views * 100
- Link Clicks to Website Sessions – Percentage of link clicks that turned into website sessions = Website Sessions / Link Clicks * 100
- Website Sessions to Clicks on “Apply” – Percentage of website sessions that turned into clicks on “Apply” = Clicks on “Apply” / Website Sessions * 100
- Clicks on “Apply” to Form submissions – Percentage of clicks on “Apply” that turned into form submissions: Form submissions / Clicks on “Apply” *100
Identify your Recruitment KPIs & Benchmarks
Ask yourself the following questions and see how many answers you have:
- What does my funnel look like for each source?
- What is my average conversion rate from website visitor to candidate?
- What is my average conversion rate from website visitor to candidate for different sources (LinkedIn, Facebook, Instagram, Google organic, Google ads, etc)?
- What is my average cost per candidate?
- What is my average cost per candidate for different sources?
- What is my average cost per hire?
- What is my average cost per hire for different sources?
- What is the evolution of conversion rates and costs over time?
- Approximately how much do I need to spend on social media for one hire for a certain job?
Answer all of these questions and you are on your way to becoming a data-driven employer. This will help you better allocate budgets and be much more effective when doing so. If you keep spending your budget on various platforms, and if you are unable to quantify the results of your efforts, then you will never be able to improve and you will never truly know what you are getting for your budget.
Social Media Benchmarks
5.81kr
Average Cost per click (CPC)
The average cost for one link click across Facebook, Instagram, and LinkedIn in 2022.
49.11kr
Average Cost per 1000 impressions (CPM)
The average cost for 1000 non-unique ad views across Facebook, Instagram, and LinkedIn in 2022.
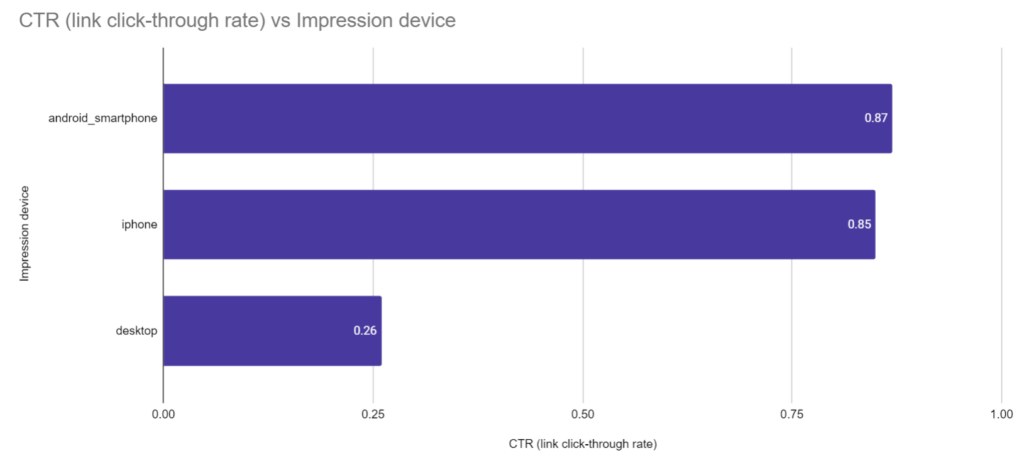
Mobile usage is skyrocketing
More and more users are accessing social media through their mobile phones. Brands have mostly adjusted to this trend when it comes to sales. The same can’t be said about recruitment.
Many companies choose to use recruitment tools that automate and improve the results of social media campaigns, and that’s great! However, ensure that you also have a mobile friendly-application process.
If you invest in a recruitment marketing automated tool, make sure you also have a mobile-friendly application process to go with it.